How I draw figures for my mathematical lecture notes using Inkscape
In my previous blog post, I explained how I take lecture notes using Vim and LaTeX. In this post, I’ll talk about how I draw figures for my notes using Inkscape and about my custom shortcut manager.
Some examples
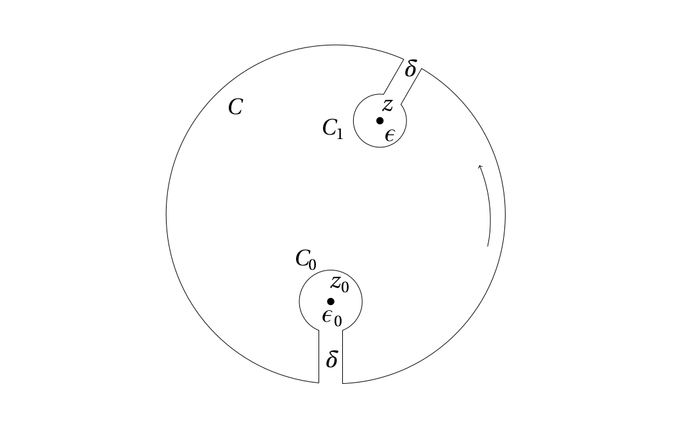
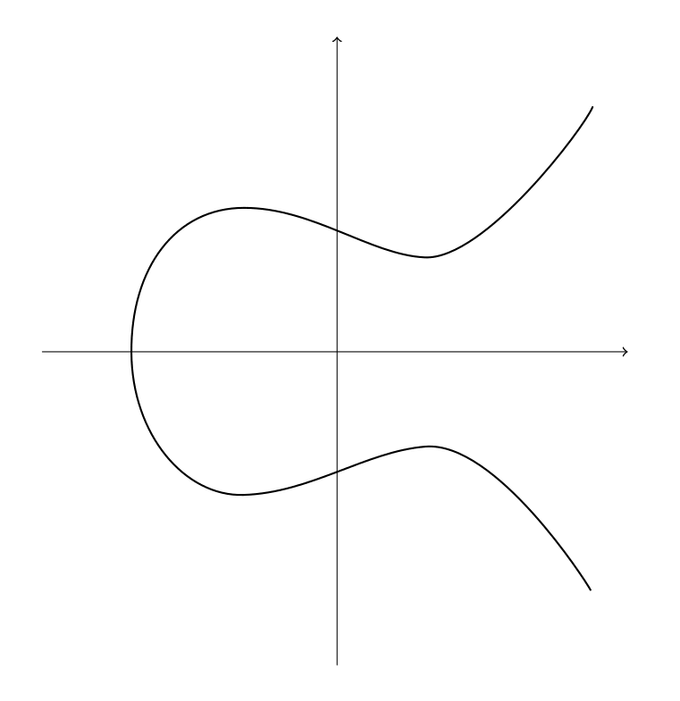
First, let me show you some examples of figures I’ve made. They were made for complex analysis, differential geometry, electrodynamics and my bachelors’s thesis on elliptic curves. I drew them during the lecture — except of course those for my thesis — using Inkscape, so let’s start with that.
What is Inkscape?
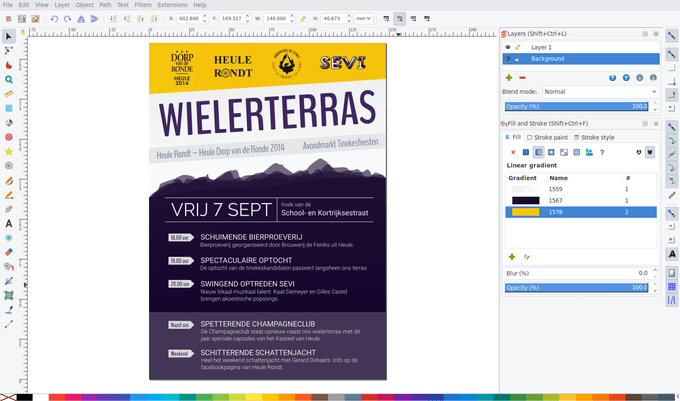
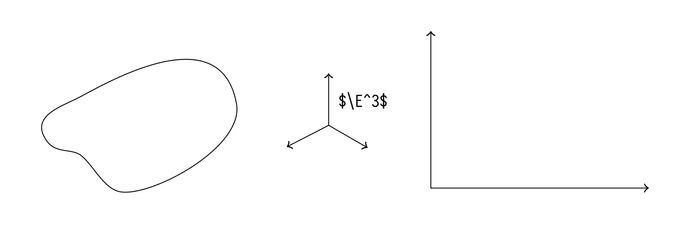
Inkscape is an open source vector graphics editor, available for all major platforms. It’s a free — but arguably less featureful — alternative to Adobe Illustrator. You can use it for designing flyers and logos like in the picture below, but it’s also a powerful tool for drawing mathematical figures.
Why Inkscape?
The most common solutions for adding figures to LaTeX documents are TikZ, PSTricks and Asymptote. These options have one thing in common: they are command based, i.e. you just write some code that specifies how the figure should be drawn. For example, the following TikZ code
\begin{tikzpicture}
    \coordinate (A) at (1, 3);
    \draw[thick, ->] (0, 0) -- (A);
    \node[above right] at (A) {$A = (1, 2)$};
\end{tikzpicture}
gives this figure:
The benefit of these packages is that drawing a figure is a lot like programming:
you can use variables, do calculations, use for loops, etc.
Furthermore figures blend in nicely in your document because all text is typeset by LaTeX itself.
This means that you can typeset math effortlessly, or that if later on, you decide to change the font of your document,
all the figures will change automatically to match the new font.
However, these assets cost you visual feedback and speed. Drawing complex figures is inherently a graphical task and without a graphical interface, it can be extremely time consuming. It’s impossible to click and drag an object to move it, freehand draw a curve or drag the control points of a Bézier curve. This makes TikZ a lot harder and slower to use than Inkscape. While I use TikZ once in a while for complex figures, I found that in most cases, the benefits of Inkscape far outweigh those of TikZ, especially if you’re under time pressure during a lecture.
With this out of the way, let’s get started.
Including Inkscape figures in a LaTeX document
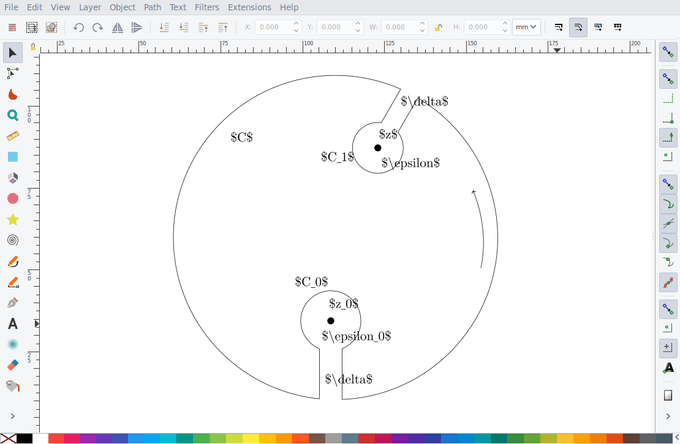
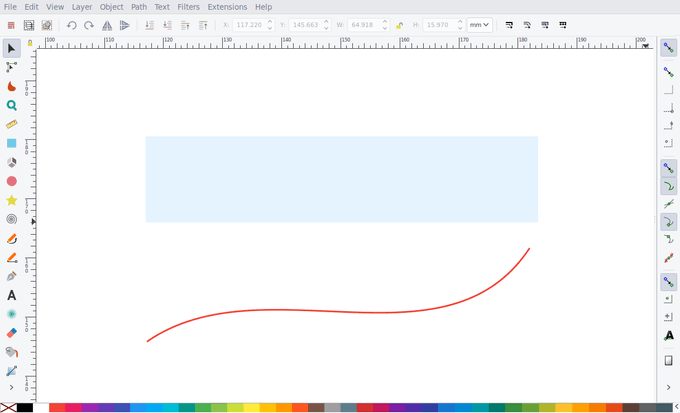
Just like TikZ, Inkscape has the option to render the text of a figure using LaTeX. For this, it exports figures as both a pdf and a LaTeX file. The pdf document contains the figure with text stripped, and the LaTeX file contains the code needed to place the text at the correct position. For example, suppose you’re working on the following figure in Inkscape:
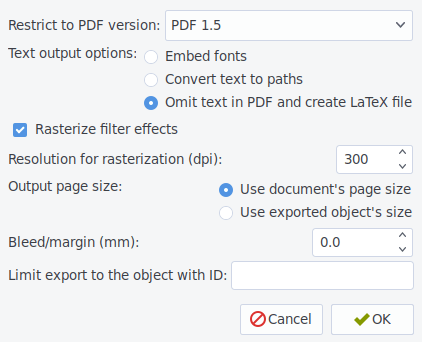
To include this figure in a LaTeX document, you’d go to File › Save As, select ‘pdf’ as the extension and then press Save which makes the following dialog pop up:
Choosing ‘Omit text in pdf and create LaTeX file’, will save the figure as pdf+LaTeX. To include these Inkscape figures in your LaTeX document, you can add the following code to your preamble:
\usepackage{import}
\usepackage{xifthen}
\usepackage{pdfpages}
\usepackage{transparent}

\newcommand{\incfig}[1]{%
    \def\svgwidth{\columnwidth}
    \import{./figures/}{#1.pdf_tex}
}
Assuming the figure is located at figures/riemmans-theorem.svg, it can simply be included with following code:
\begin{figure}[ht]
    \centering
    \incfig{riemmans-theorem}
    \caption{Riemmans theorem}
    \label{fig:riemmans-theorem}
\end{figure}
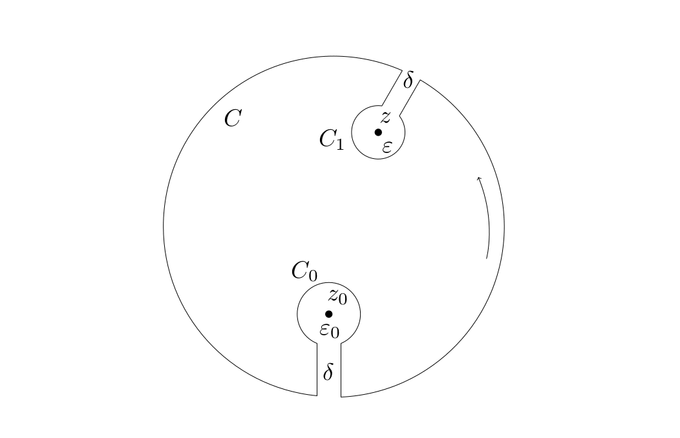
Compiling your document, you’d get the following.
As you can see, the text is rendered by LaTeX which makes the figure blend in beautifully. When you later decide to change the font, it gets updated accordingly:
This setup allows you to draw figures in Inkscape, while still having the power of LaTeX for typesetting.
Creating and including figures quickly
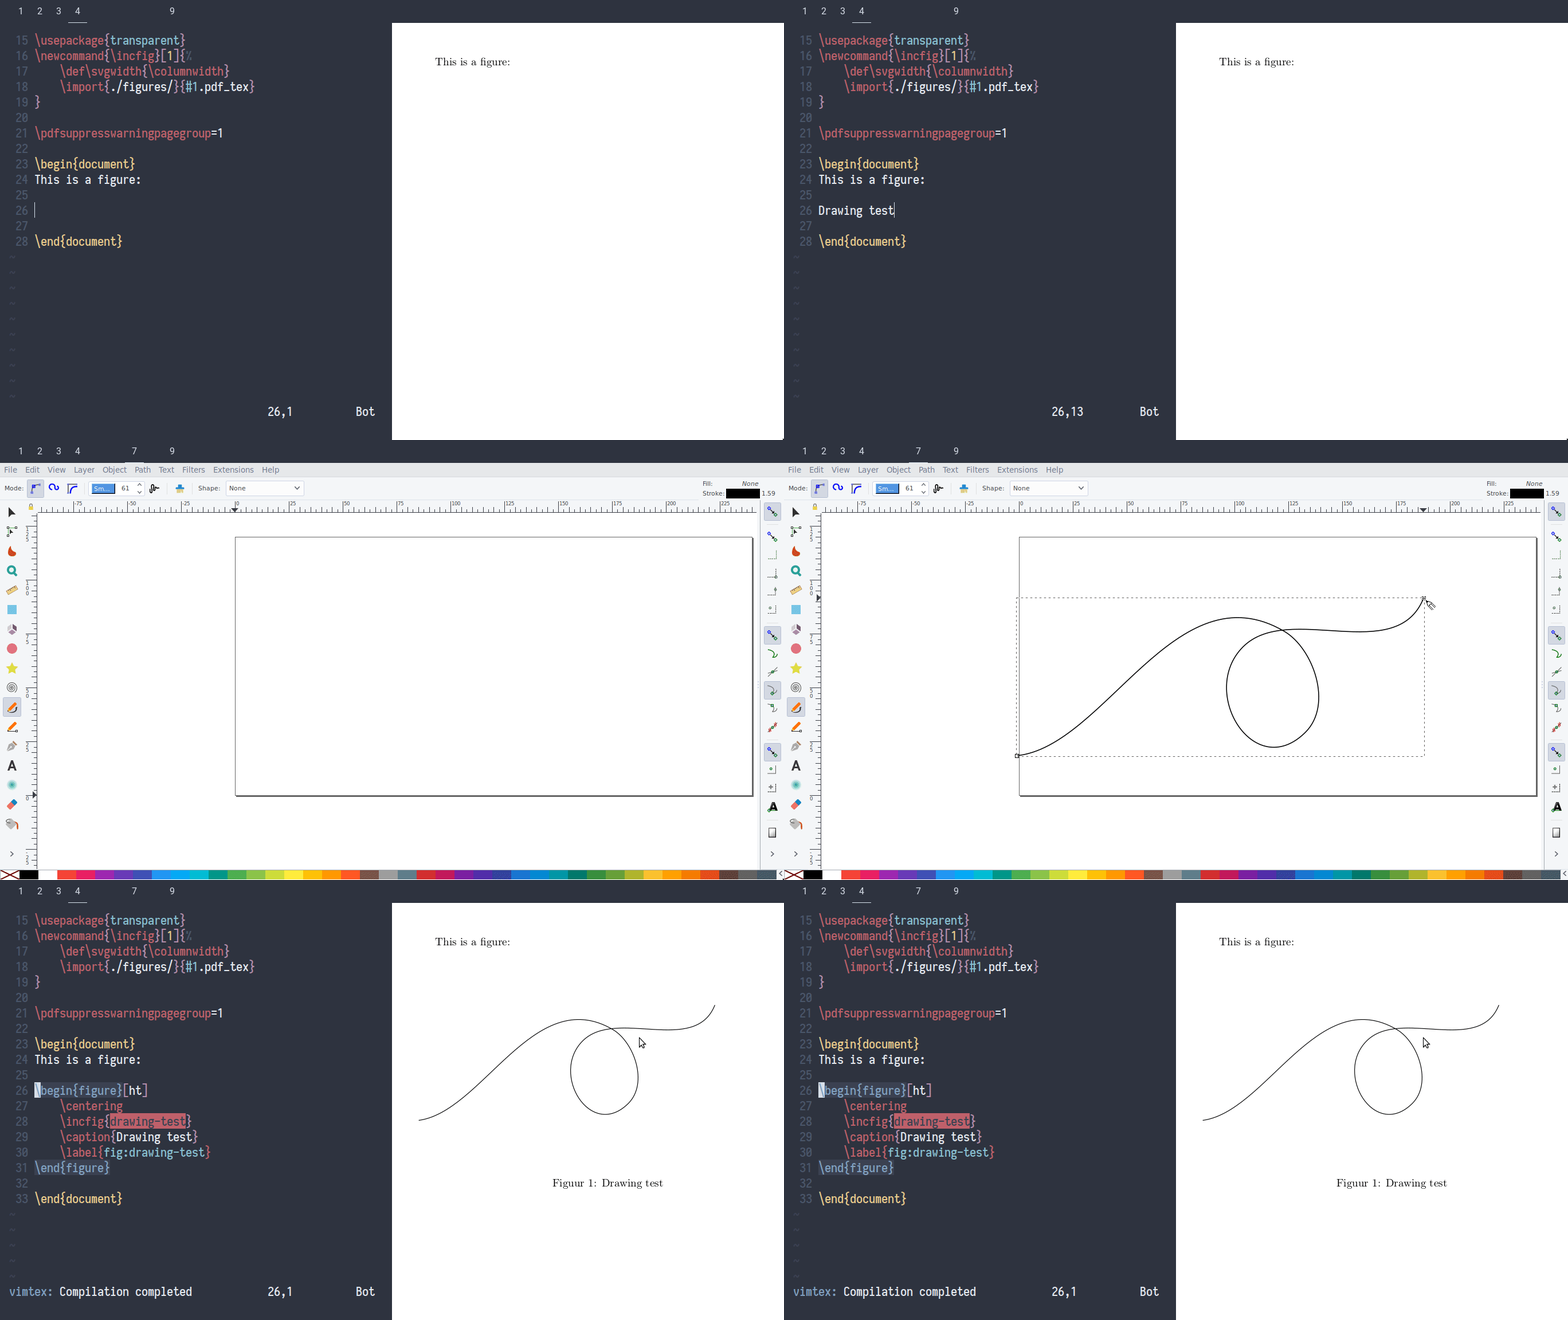
When I’m taking notes during a lecture, I need to be able to add a figure without disrupting my flow, and not spend time opening Inkscape, searching for the correct directory, typing the LaTeX code for including the figure manually and so on. To avoid this, I added some shortcuts to Vim for managing my figures. For example, when I type the title of the figure I want to create and press Ctrl+F, the following happens:
- The script finds the figures directory depending on the location of the LaTeX root file.
- Then it checks if a figure with the same name exists. If so, the script does nothing.
- If not, my figure template gets copied to the figures directory.
- The current line which contains the figure title gets replaced with the LaTeX code to include the figure.
- The new figure opens in Inkscape.
- A file watcher is set up such that whenever the figure is saved as an svg file by pressing Ctrl + S, it also gets saved as pdf+LaTeX. This means that the annoying pdf save dialog we’ve discussed before doesn’t pop up anymore.
See it in action:
When I want to edit a figure, I can press Ctrl+F in normal mode to open a selection dialog that allows me to search for figures in the current document. Upon selecting one, it shows me the figure in Inkscape. When I save the figure, the code for including it is copied to the clipboard. This way, I can reinclude it if I deleted the original code to do so.
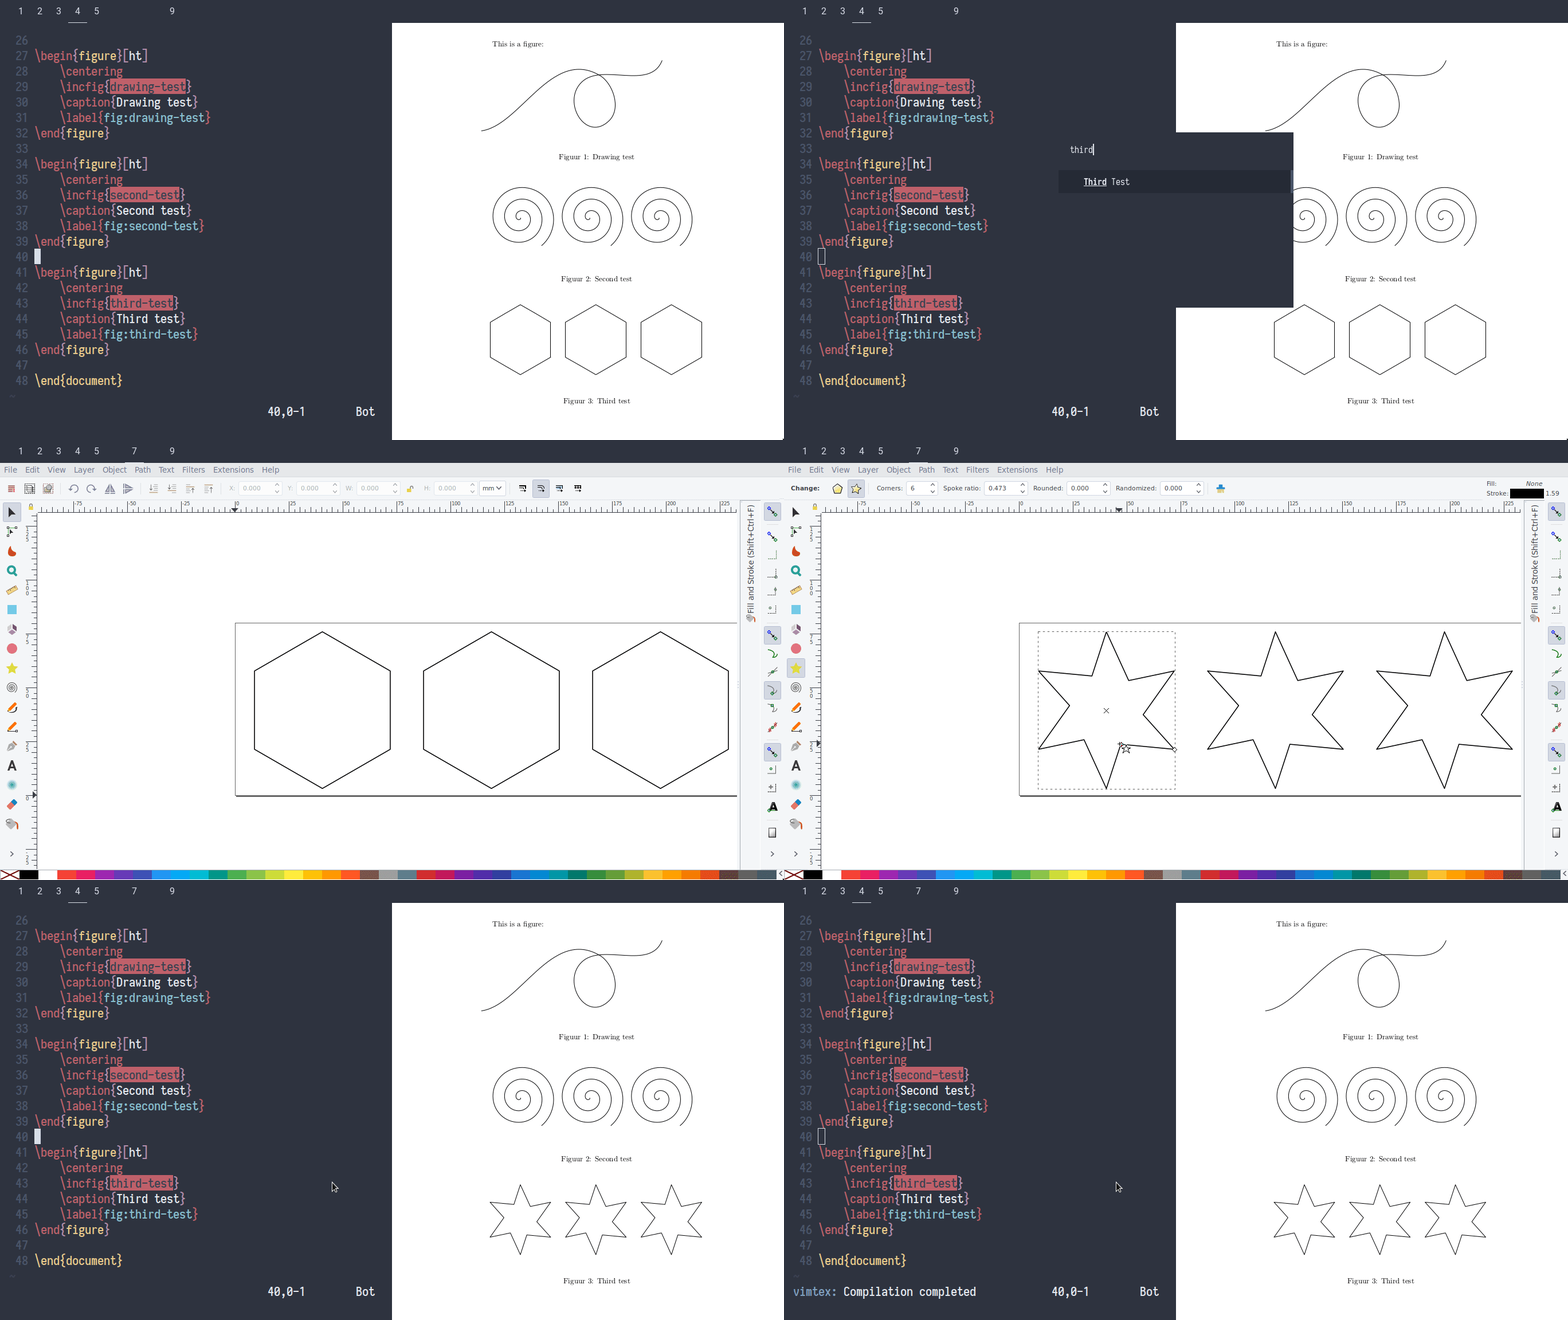
These shortcuts make adding and opening figures a breeze. I don’t have to remember saving figures as pdf+LaTeX, pick the right directory or write the code needed for including the figure. The barrier to add a new figure is much lower than if I’d have to do those things manually. You can find my script for managing figures on Github.
Now that I’ve explained how I manage my figures, I’d like to talk about actually drawing figures in Inkscape.
Drawing figures
While drawing figures in Inkscape is quite a bit faster than using TikZ in most cases, it is still slower than drawing them by hand. Using the built-in shortcuts of Inkscape speeds up the process but it still doesn’t hit the mark.
Therefore, I decided to program a custom shortcut manager in Python which allows me to intercept all keyboard events before they reach Inkscape. This way, I have full control over how every keystroke gets interpreted, giving me a lot of flexibility.
Drawing shapes
Let’s start with the built in keyboard shortcuts of Inkscape. For example, r activates the rectangle drawing tool, e draws ellipses, etc. Implementation-wise, this means that the shortcut manager will ‘replay’ these keyboard events, i.e. it’ll just pass them through to Inkscape.
However, instead of the default shortcuts p for pencil and b for the Bézier tool, I use w and f, as these are a bit more comfortable to reach while using a mouse with my right hand. In the spirit of making shortcuts left handed, I also mapped z to undo, Shift+z to delete, and x to toggle snapping which is normally the hard to reach % key.
Key chords to apply commonly used styles
Styling objects is the second most common thing I do in Inkscape. The styles I use for drawing figures are quite simple:
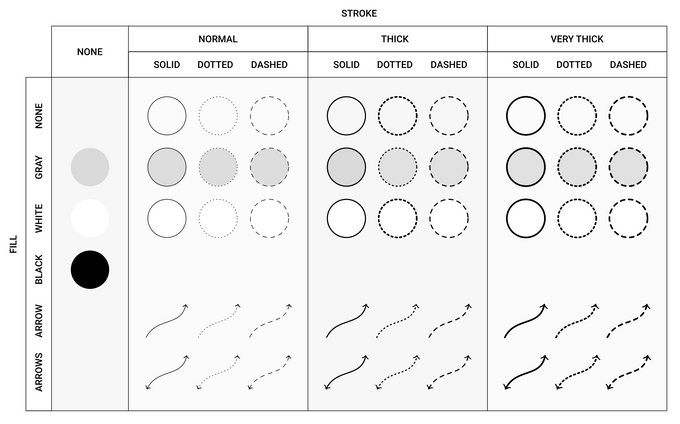
- Shapes e.g. rectangles or circles are mostly black, light gray, white or transparent and optionally have a stroke.
- Lines (including strokes) are mostly solid, dotted or dashed. They can be (very) thick or have a normal width and optionally have an arrow on either side.
These options combined give the following table of commonly used styles:
As applying these styles is something I do very frequently, I want it to be fast, but using the default shortcuts in Inkscape takes too long. For example, suppose you’d like to change the style of some objects as follows:
You’d press Ctrl+Shift+F to open the styles panel, and update the style of each object by clicking because you can’t do this using keyboard shortcuts in Inkscape. This is tiresome. Ideally, it should only take a fraction of a second.
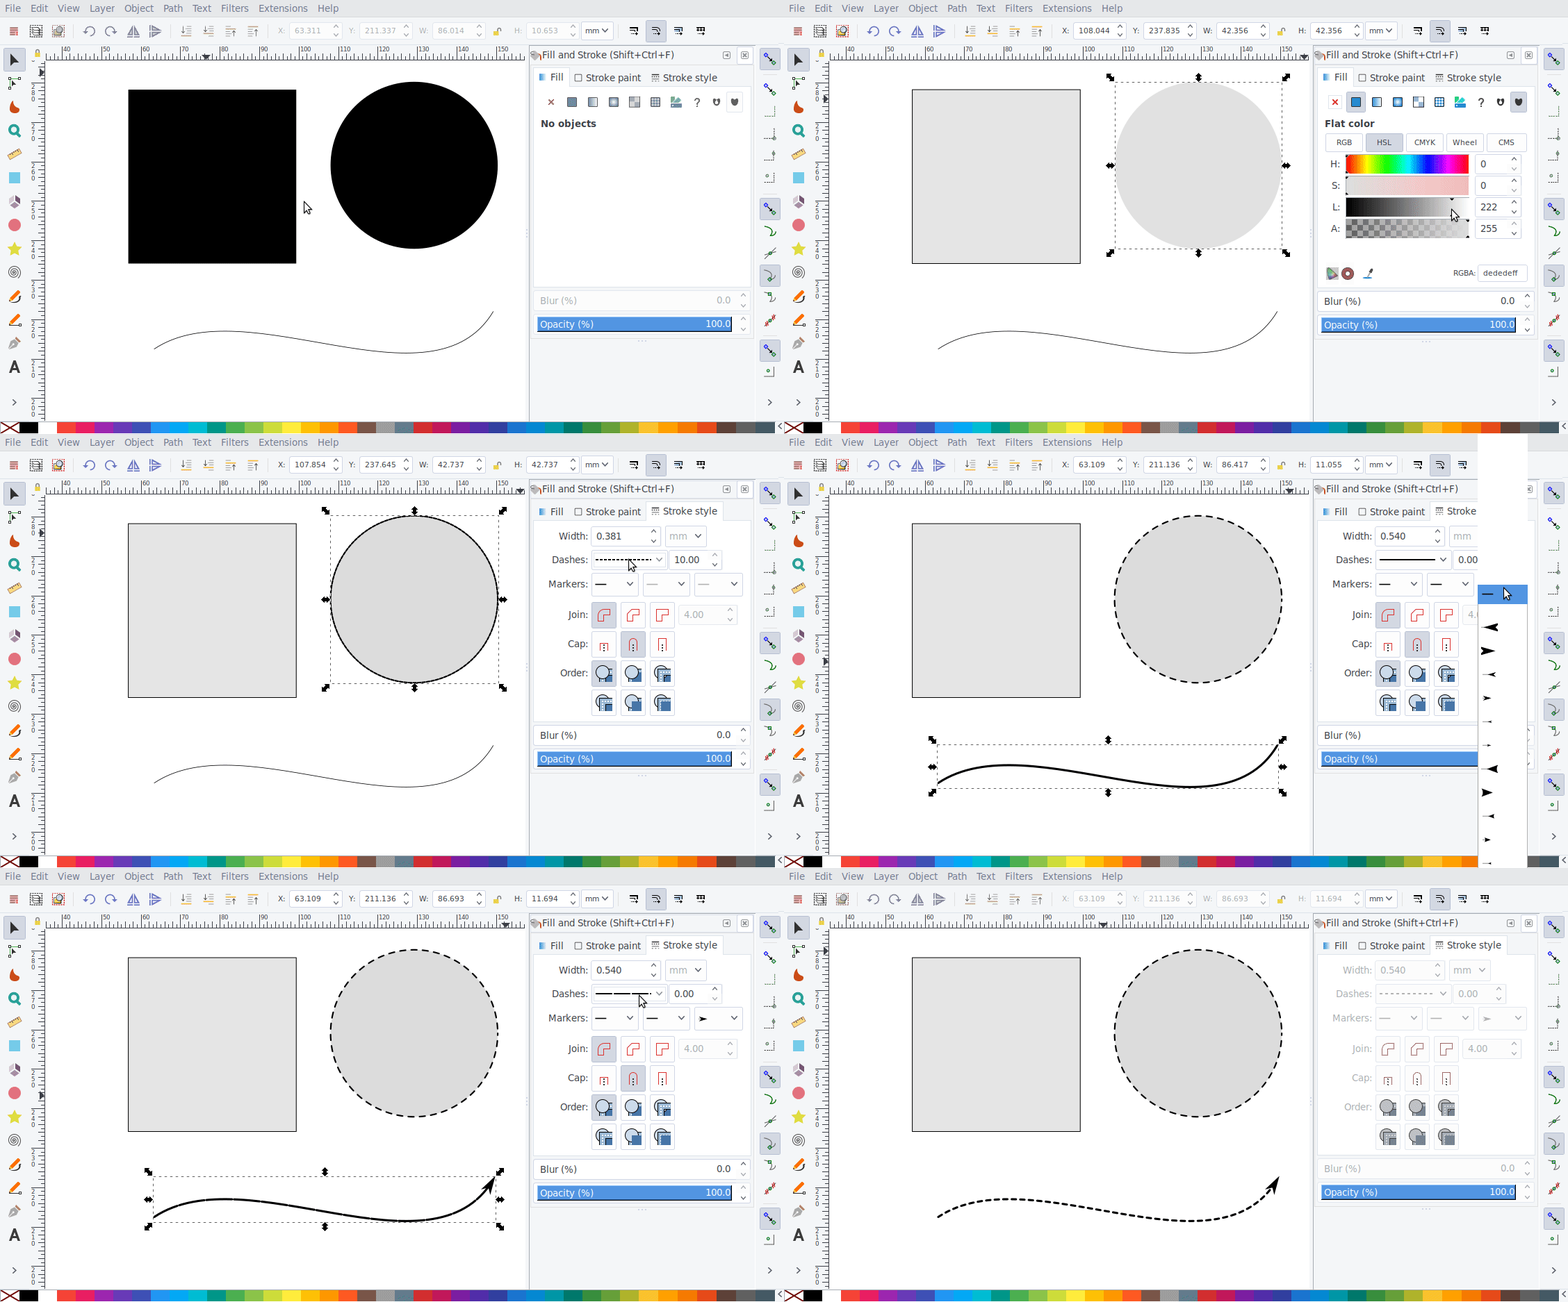
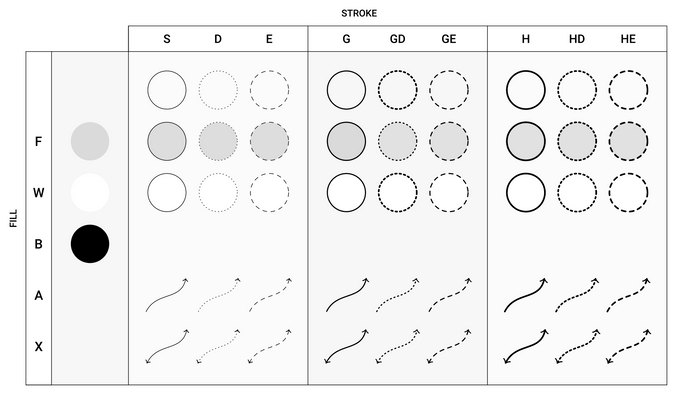
This is where key chords come into play. A key chord is a keyboard shortcut which consists of two or more simultaneous keystrokes. For example, when I press s and f simultaneously, my shortcut manager will apply a solid stroke and a grey fill to the current selection. When I want the stroke to be thick, I press s+f+g together, where g stands for thick (as the t key is hard to reach).
This way, every styling property corresponds to a key: s stands for normal stroke, f for gray fill, g for thick, a for arrow, d for dotted, e for dashed, etc. Here’s the full table of possible options:
Some styles in this table corespond to only one key, e.g. the style in the top left corner: filled in gray without a stroke. This could present a problem, as only pressing f gets you the Bézier tool. The solution is to press Space + f where Space acts like a placeholder.
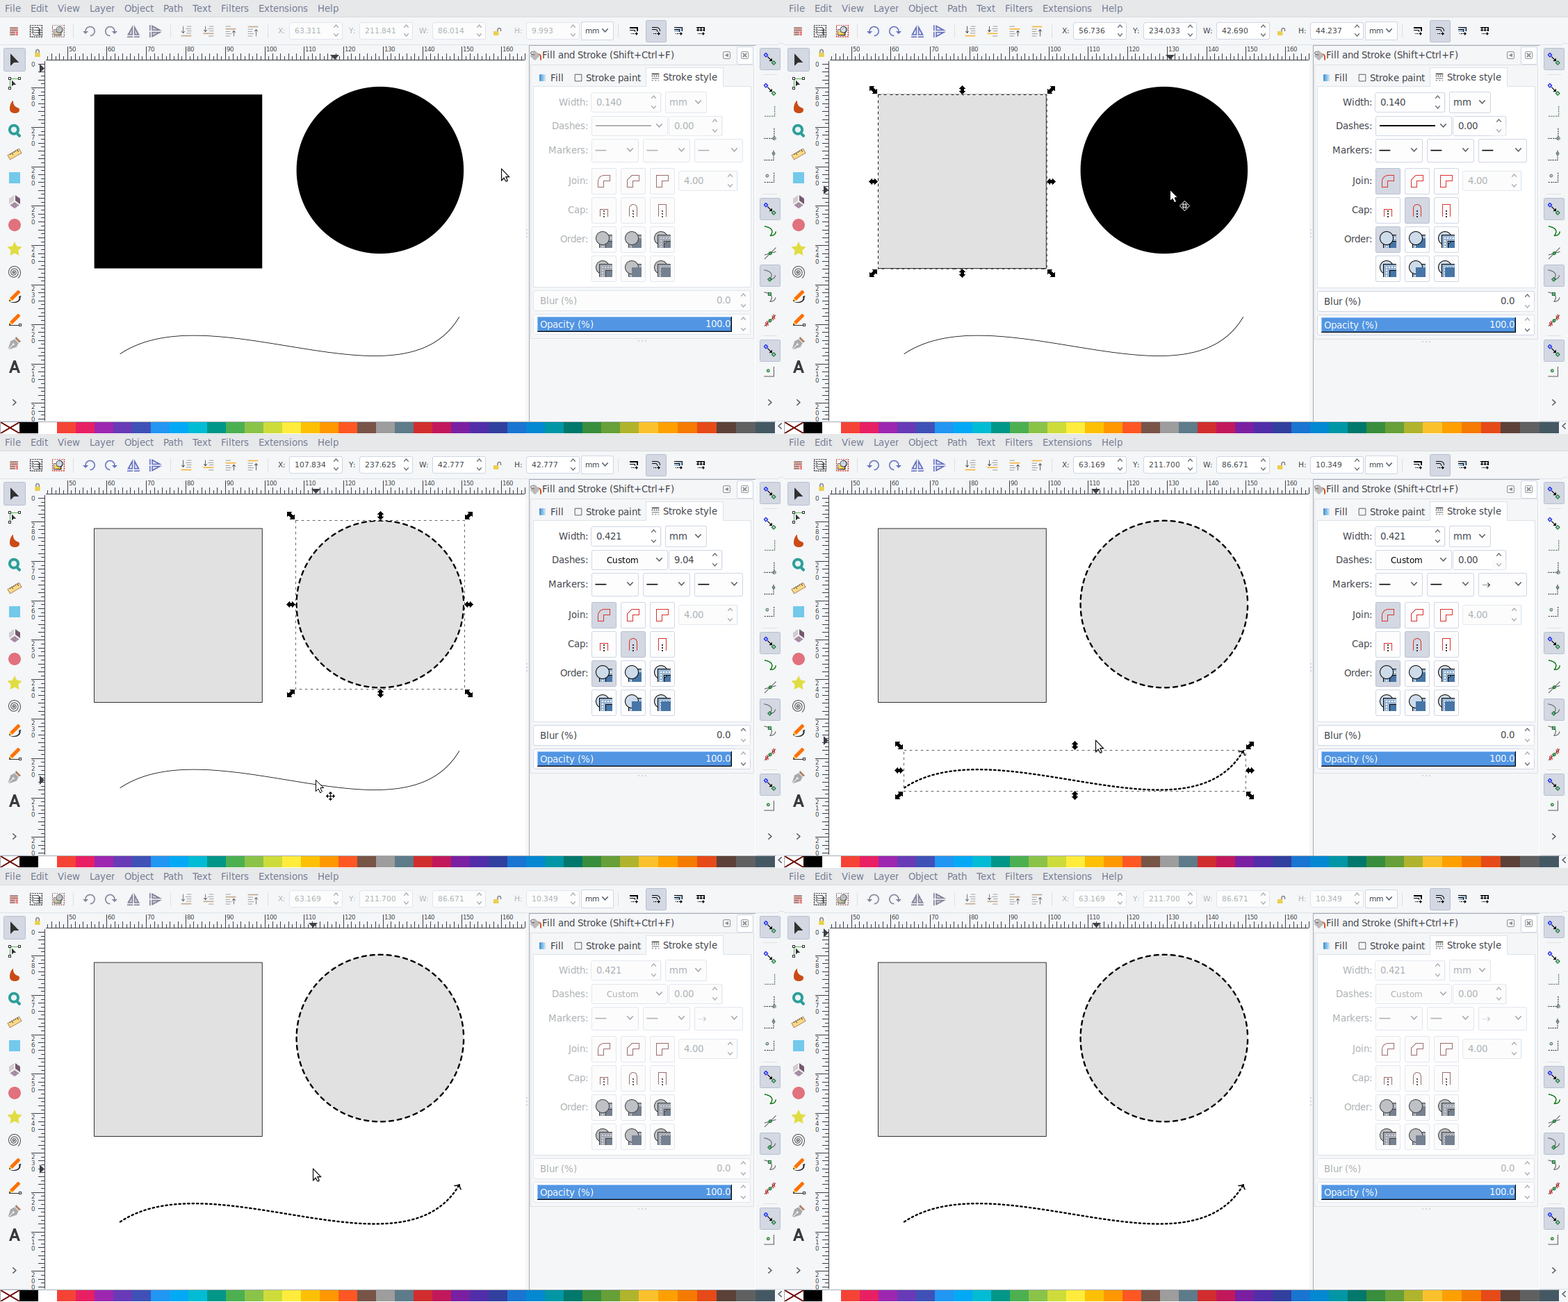
Using these key chords, the previous problem can be solved in a few keystrokes:
- f+s makes the rectangle gray and gives it solid border.
- f+h+e stands for 'filled and very thickly dashed'.
- a+g+d adds an arrow and makes the line thickly dotted.
Adding text
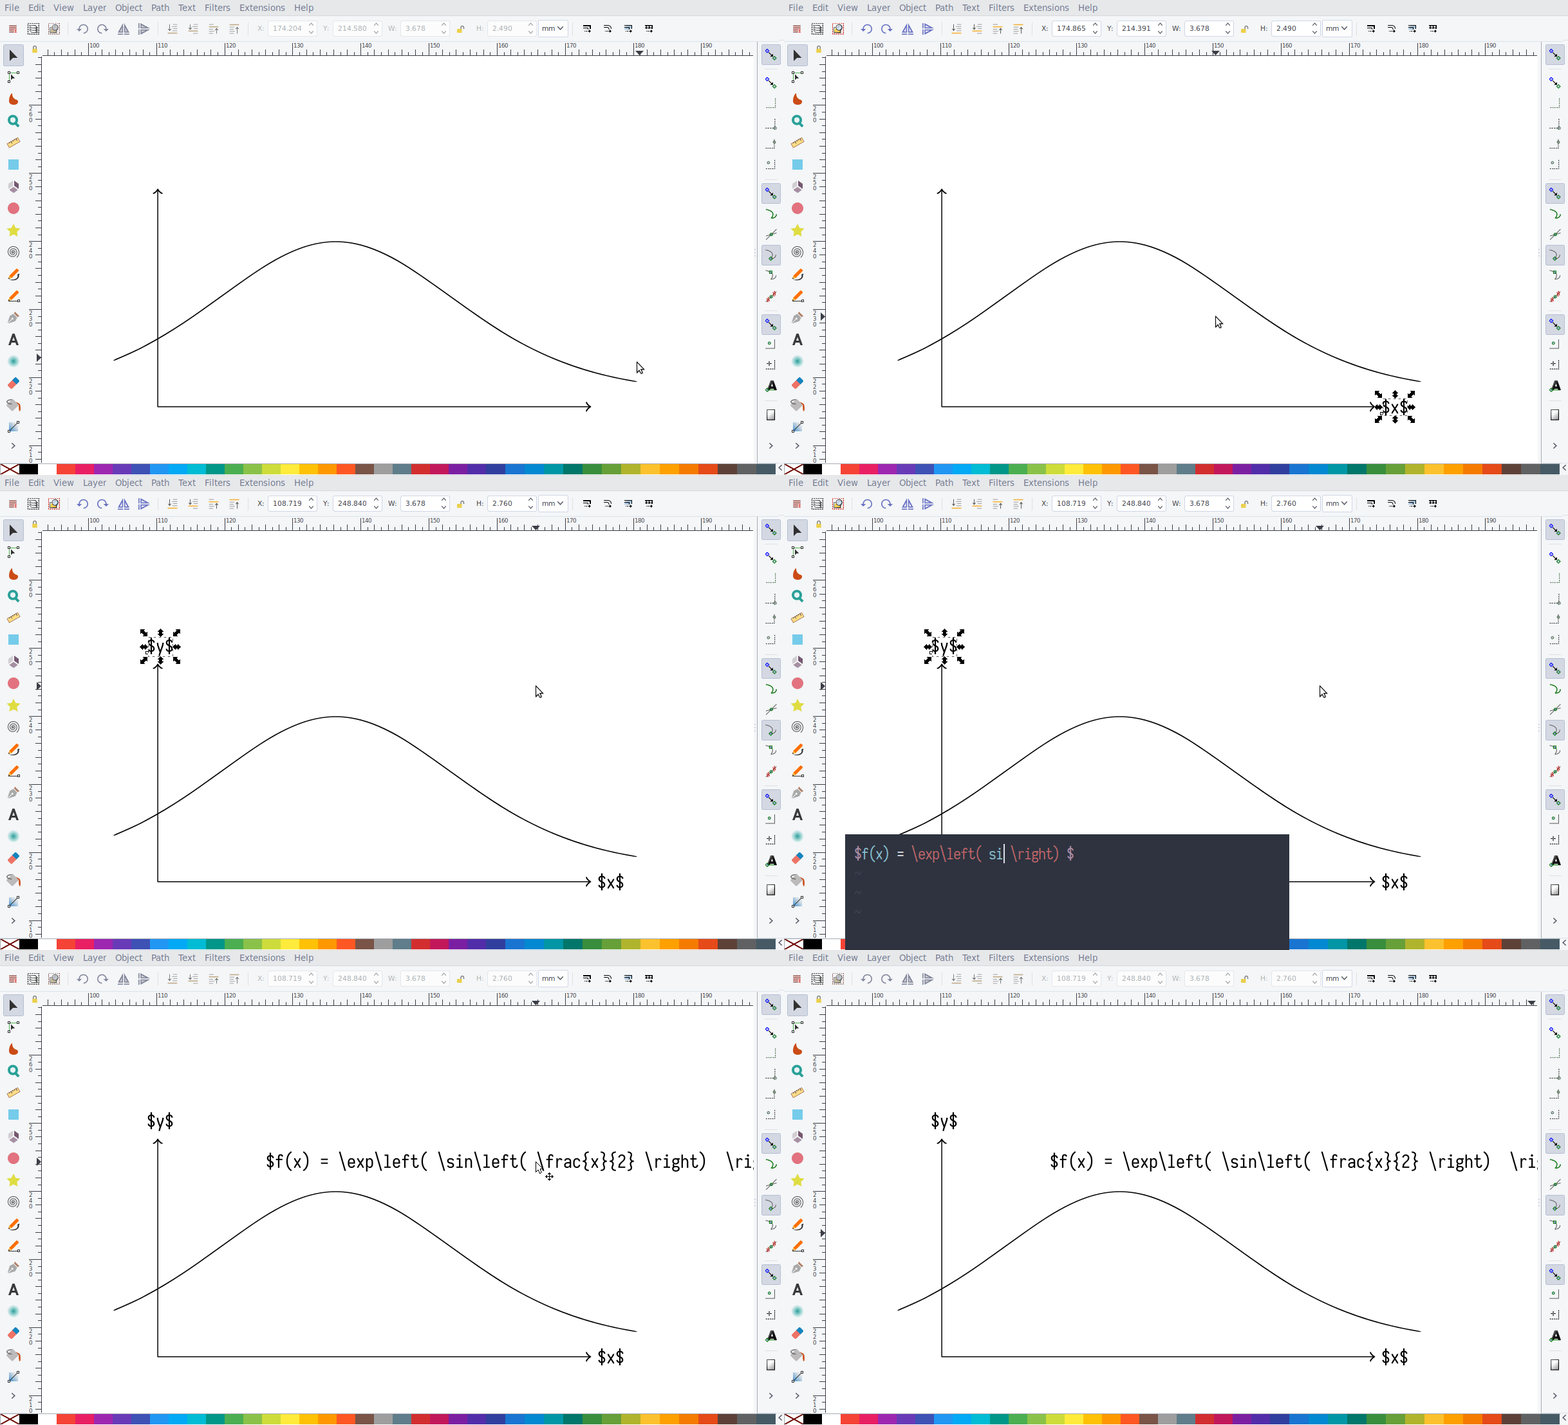
Another important part of making figures is adding text. As figures often include mathematical formulas, I want to be able to use my snippets in Vim. To ensure this, I can press t which opens a small Vim window where I can type LaTeX. When I quit, a text node is inserted in Inkscape:
As I covered before, this text will be rendered by LaTeX when I insert the figure in a document. However, sometimes I want to render some LaTeX immediately, which I can do with Shift+T:
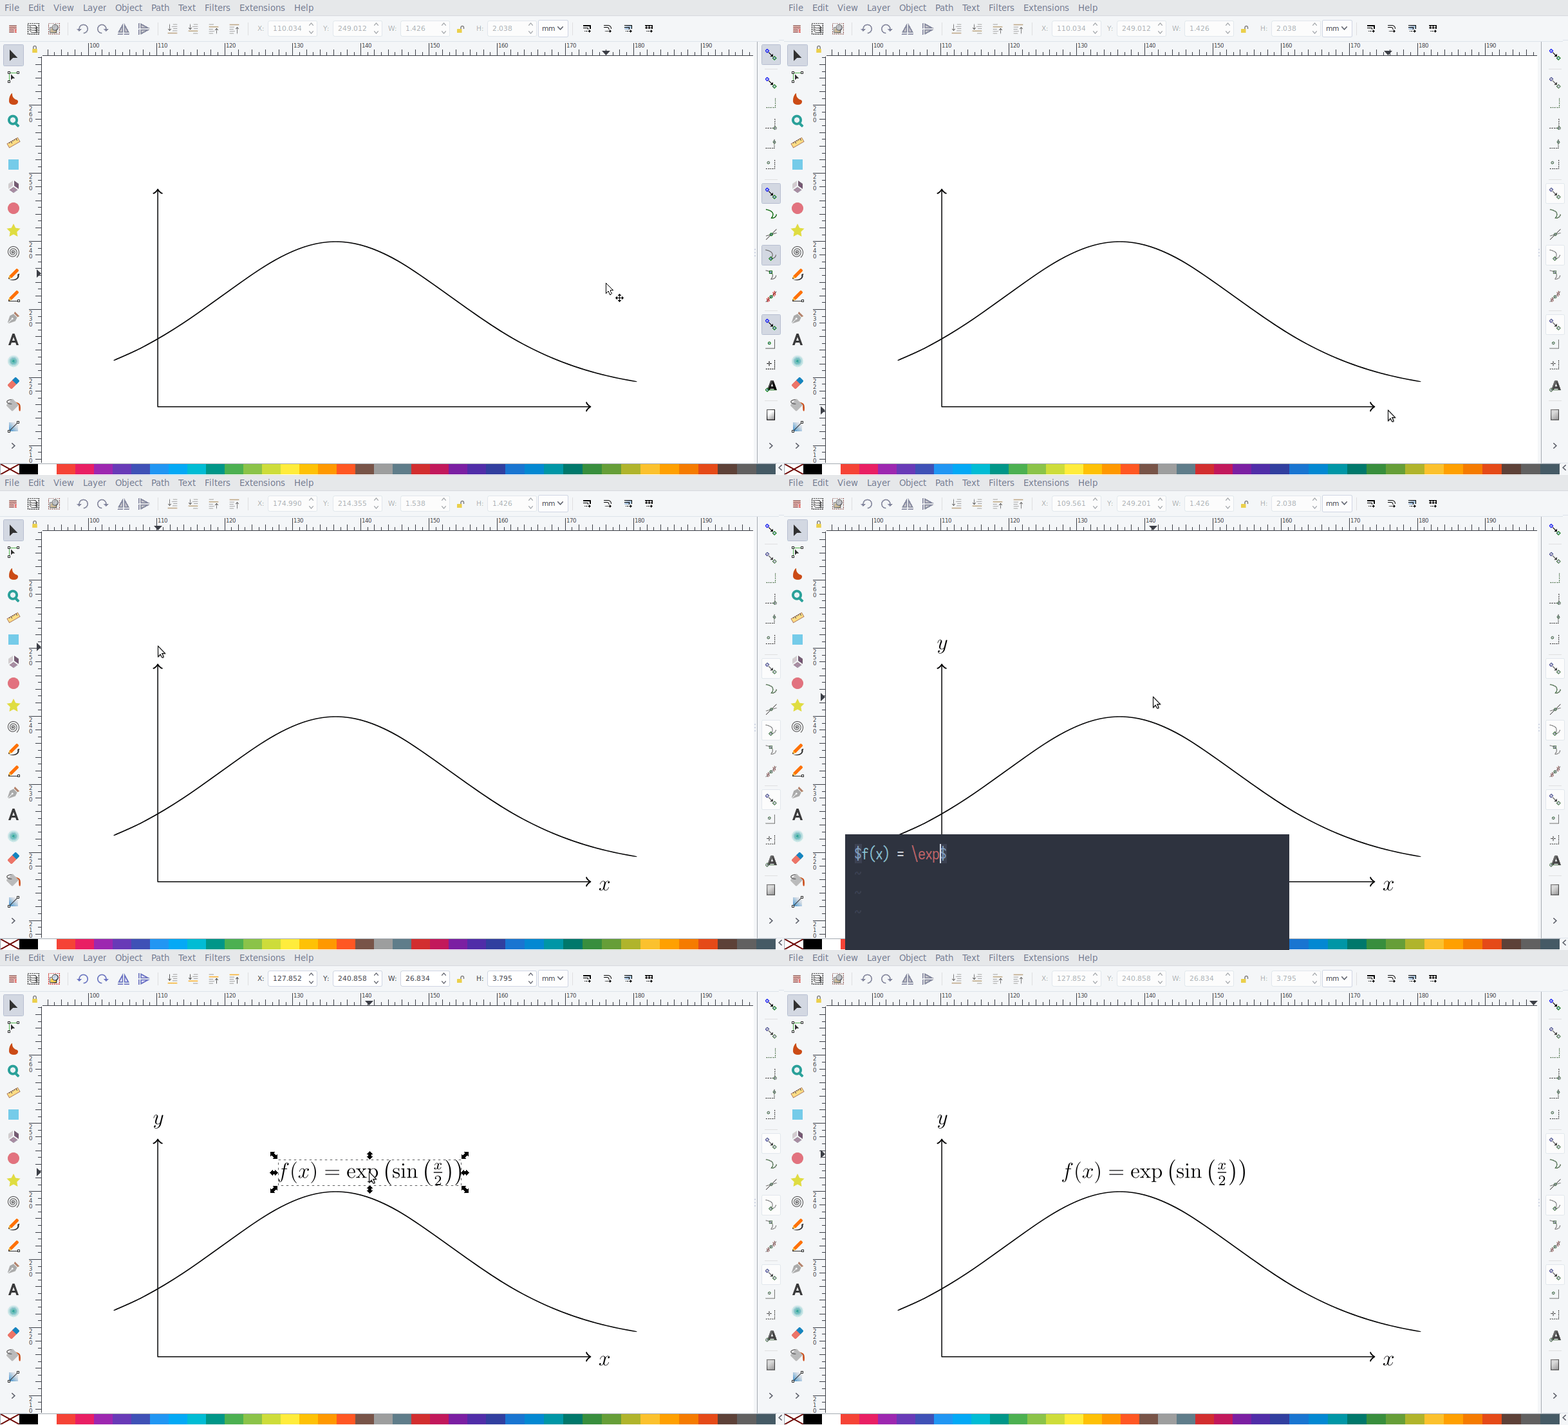
Both these options have their advantages and disadvantages. I mainly use the first method because the text is rendered by the LaTeX document. This means the font will always match and that you can use macros defined in the preamble of your document. A disadvantage however is that positioning of text is sometimes a bit difficult. As you don’t see the final result in Inkscape, it sometimes requires some hopping from Inkscape to my pdf viewer and back to fine-tune the results.
Saving and using less commonly used styles
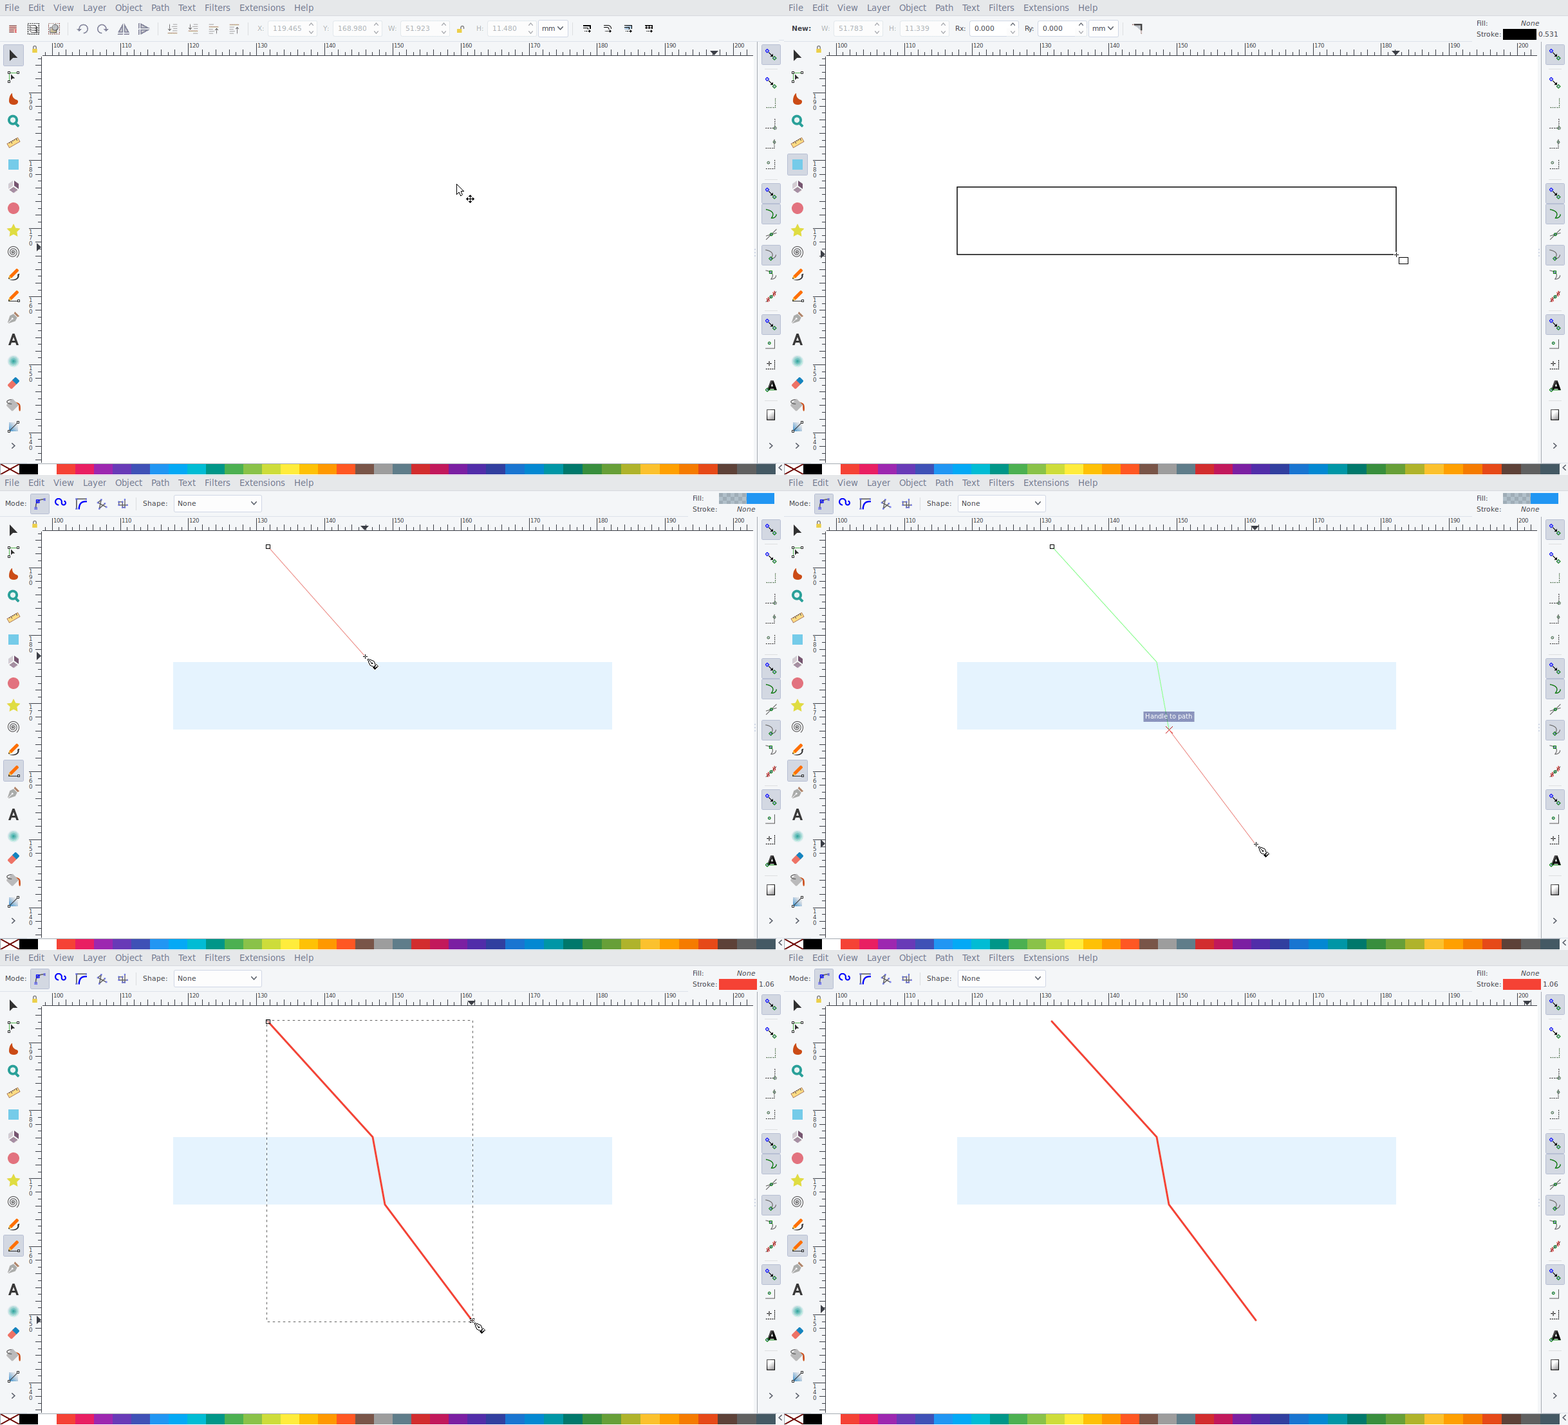
While the key chord styles suffice 90% of the time, I sometimes want to use a custom style. For example, to draw optics diagrams it’s useful to have a glass and a ray style. To achieve this, I first have to create the style in Inkscape using the default shortcuts:
To save these styles, I select one of these objects and press Shift + s. Then I type the name of the new style, in this case, ‘glass’ and press enter to confirm. Now this style is saved and I can use it later on.
Now, when I select an object, press s and type ‘glass’, the corresponding style will be applied to the object. However, it’s not necessary to type the full name because style gets applied immediately when there an unique style matching the typed characters so far. For example, if I’d have only one style starting with ‘g’, typing ‘g’ would be enough to apply the style. If you’d have multiple styles, ‘gl’ or maybe even ‘gla’ would be necessary.
The annoying thing about this is that whenever you type too many characters — i.e. suppose typing ‘gl’ would apply the style, but you’ve typed ‘gla’ — the remaining keys, in this case a would be interpreted as another command, which would give unintended results. Therefore, the shortcut manager waits 500 ms before it goes back to the default mode. This is enough time for a human to see that the style has been applied and to stop typing.
Adding and saving objects
The final element of my setup is adding and saving objects. I can add them with a and save them with Shift+a. For example, pressing a and typing ‘ec’ adds an elliptic curve:
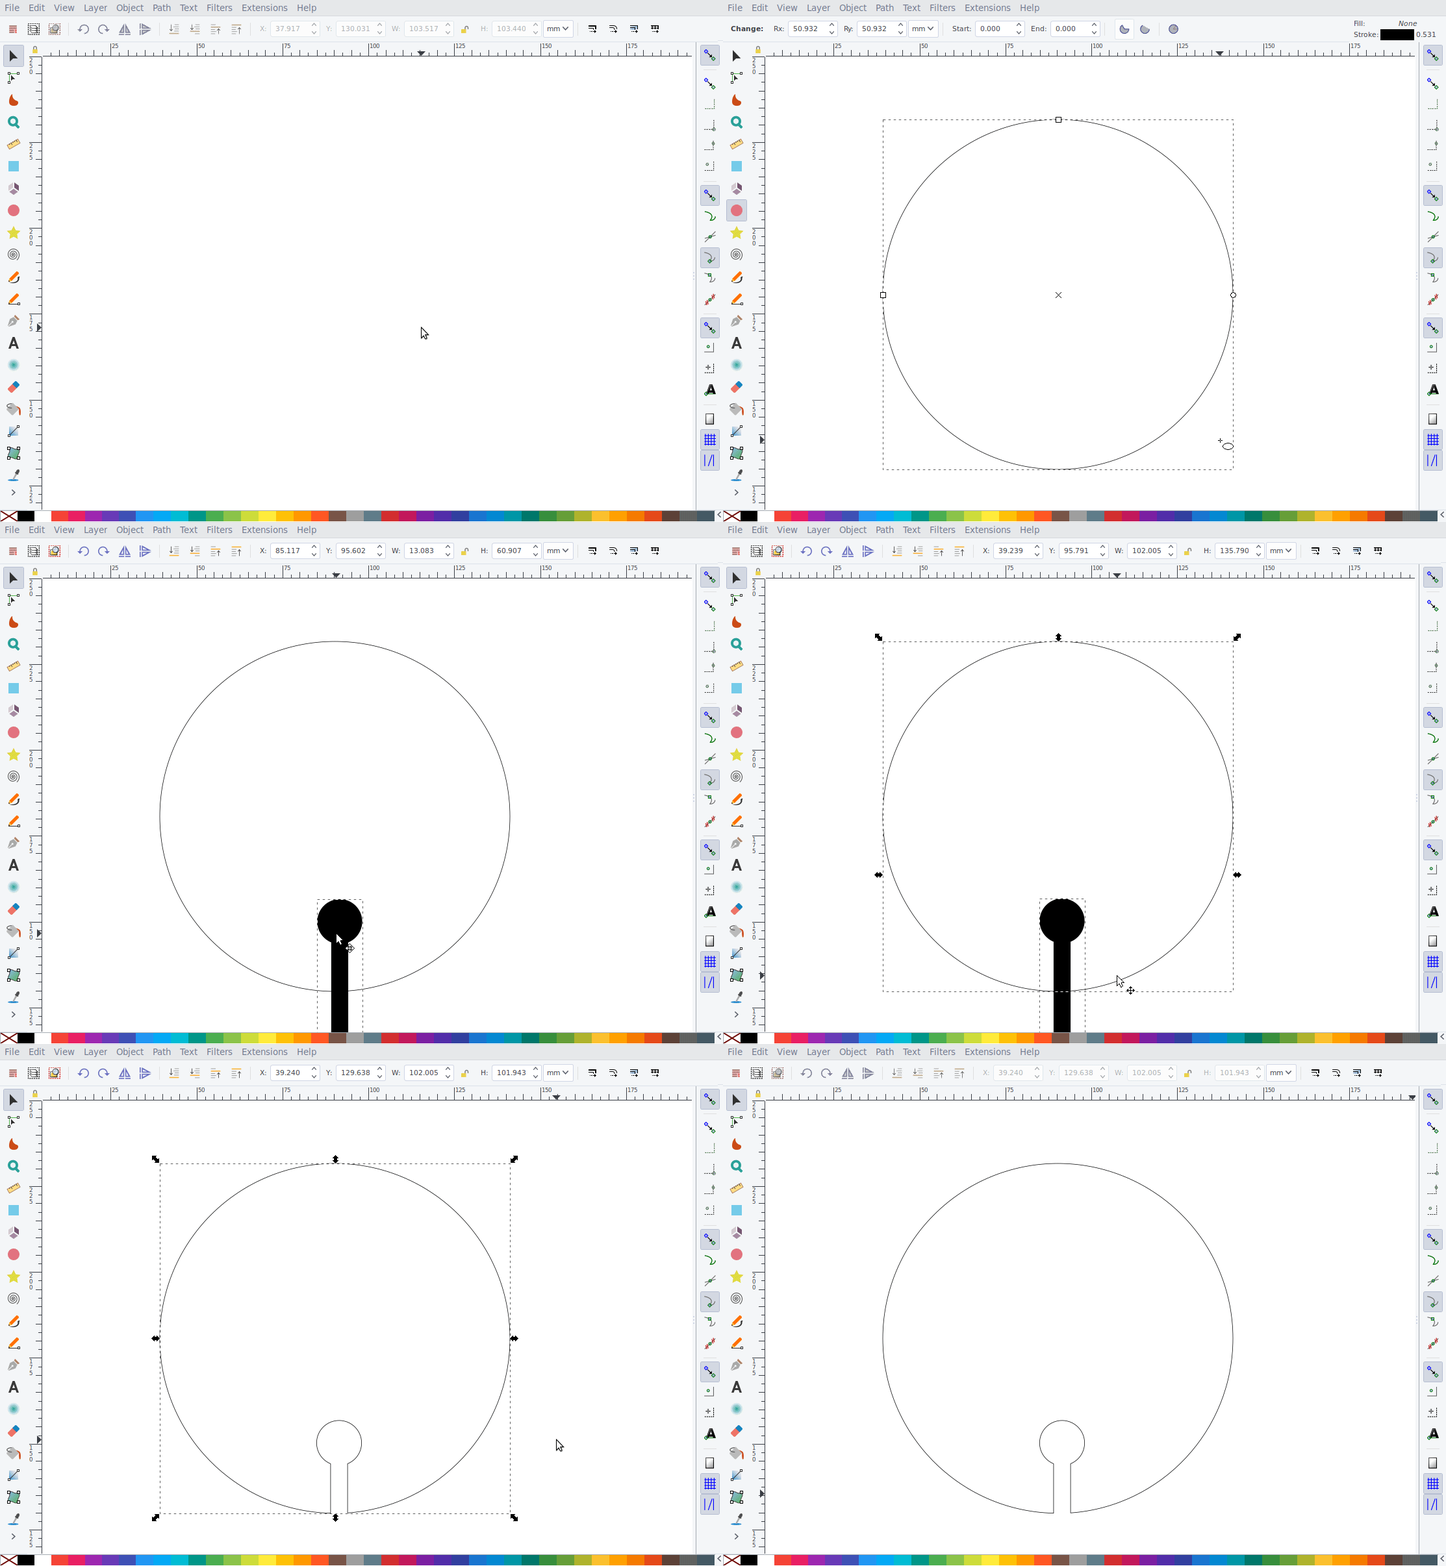
As another example, pressing a and typing ‘dg’ adds a ‘keyhole’ (‘dg’ is the mirror image of ‘kh’ on the keyboard). I can use Ctrl+- to subtract it from a given shape:
Some other examples are blobs and 2D, 3D axis, which I’ve used quite frequently in complex analysis and differential geometry.
Code
If you want to try this out for yourself, you can find both my script for managing figures in Vim and my Inkscape shortcut manager on Github. The first script should work out of the box on both Mac and Linux-based systems; the second only works on Linux (it uses Xlib) and is a bit harder to set up.
Conclusion
Using Inkscape, drawing figures for articles, books and presentations is a breeze. They look professional and blend in nicely in your document. While it’s slower than drawing them by hand, it’s faster than TikZ in most cases. My custom shortcuts and my script for managing figures in Vim make it even faster, allowing me to draw figures during lectures.
Liked this blog post? Consider buying me a coffee!


